
Market data
See sales, rentals and development near your site.
Market data#
See sales, rentals and development near your site.
Access: Pro Annual. Listings, dates and fields vary by market and provider. A blank map is not proof that no properties exist. Trial access is temporary; continuing market-layer access requires Pro Annual.
The map screenshots below were captured in Pillar in Dallas, Texas, on September 9, 2026. They show actual layer markers and labels, with other overlays hidden so each layer is easy to see. Listings and prices can change; coverage varies by location.
What you get#
Map individual listings and sales, open a record, and compare the price, property size and available details. These seven layers cover different parts of the market.
Read the example#
| Detail | Price | Size | Status |
|---|---|---|---|
| Example home A | $485,000 | 1,850 sq ft | Sold |
| Example home B | $2,450/mo | 1,620 sq ft | For rent |
| Example parcel C | $790,000 | 12.4 acres | For sale |
| Example land D | $620,000 | 10.1 acres | Sold |
All values above are sample data.
Try it in Pillar#
- Open Layers and expand Market Data.
- Choose a layer, then move to your area of interest.
- Select a record to review the available listing or transaction details.
Explore the market layers#
Homes Sold#
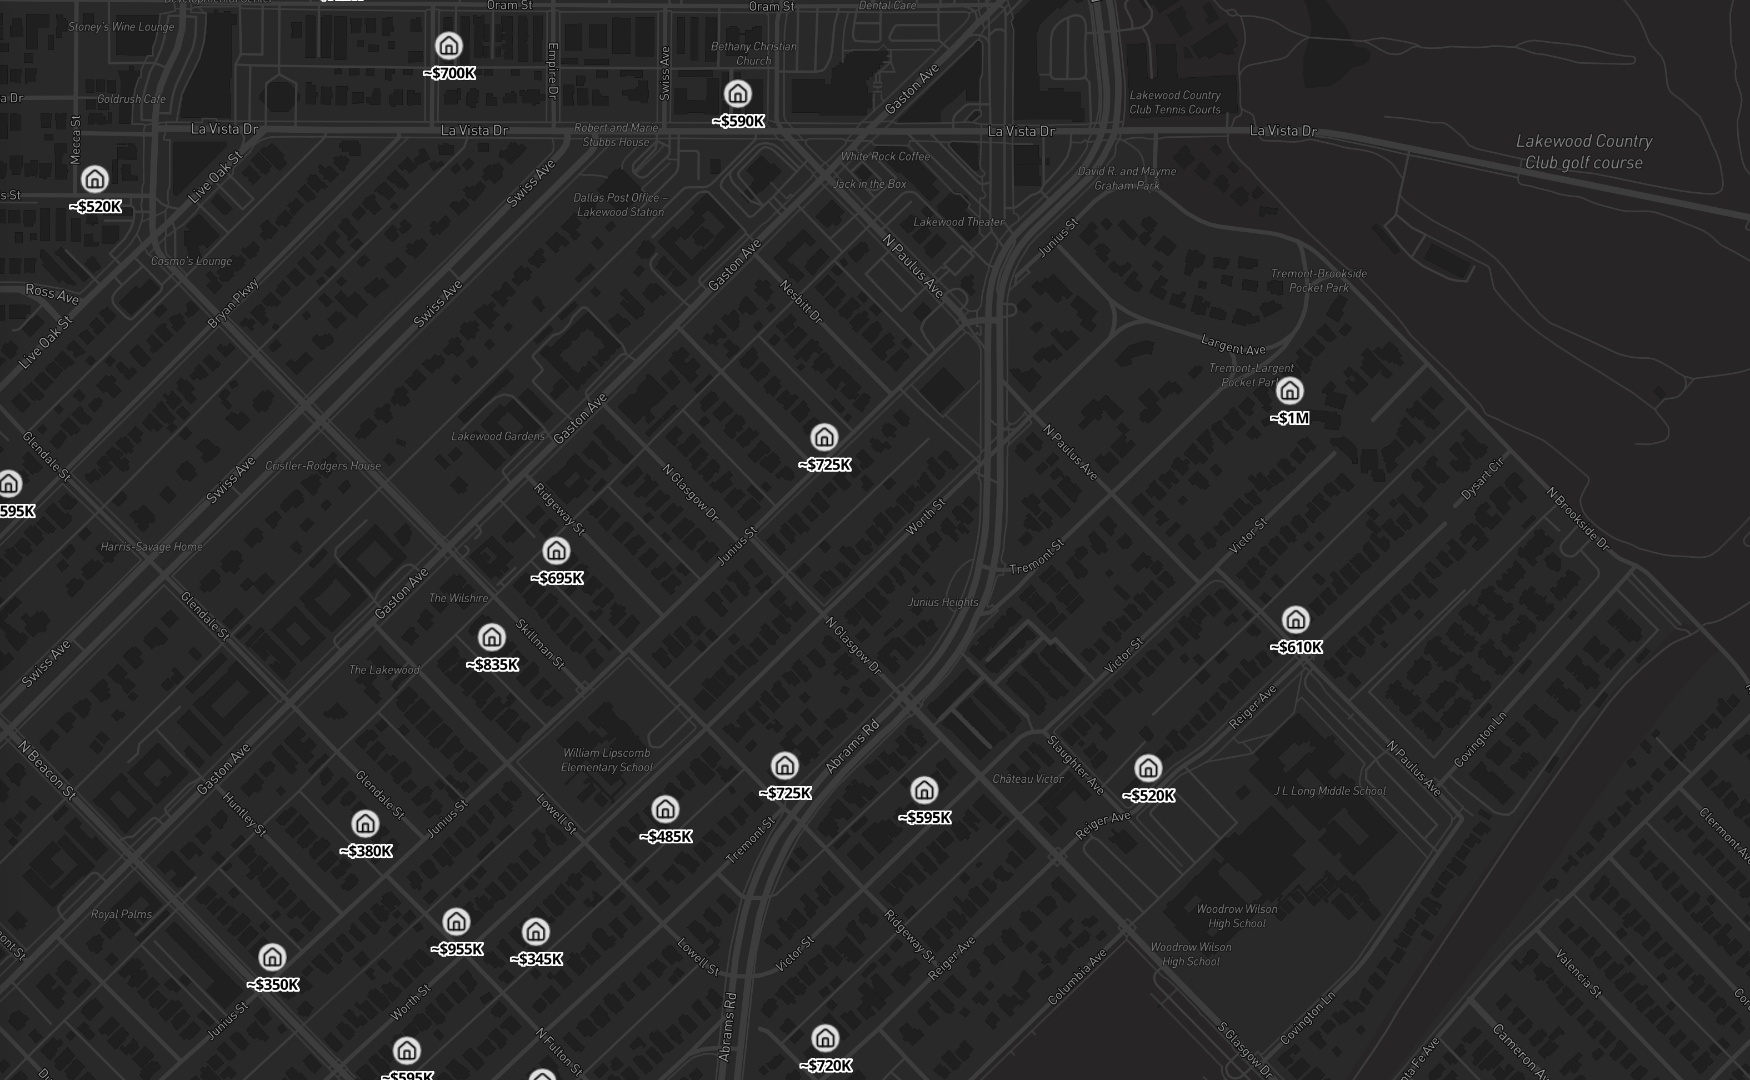
Review available sale prices, property sizes and transaction details.
Homes for Sale#
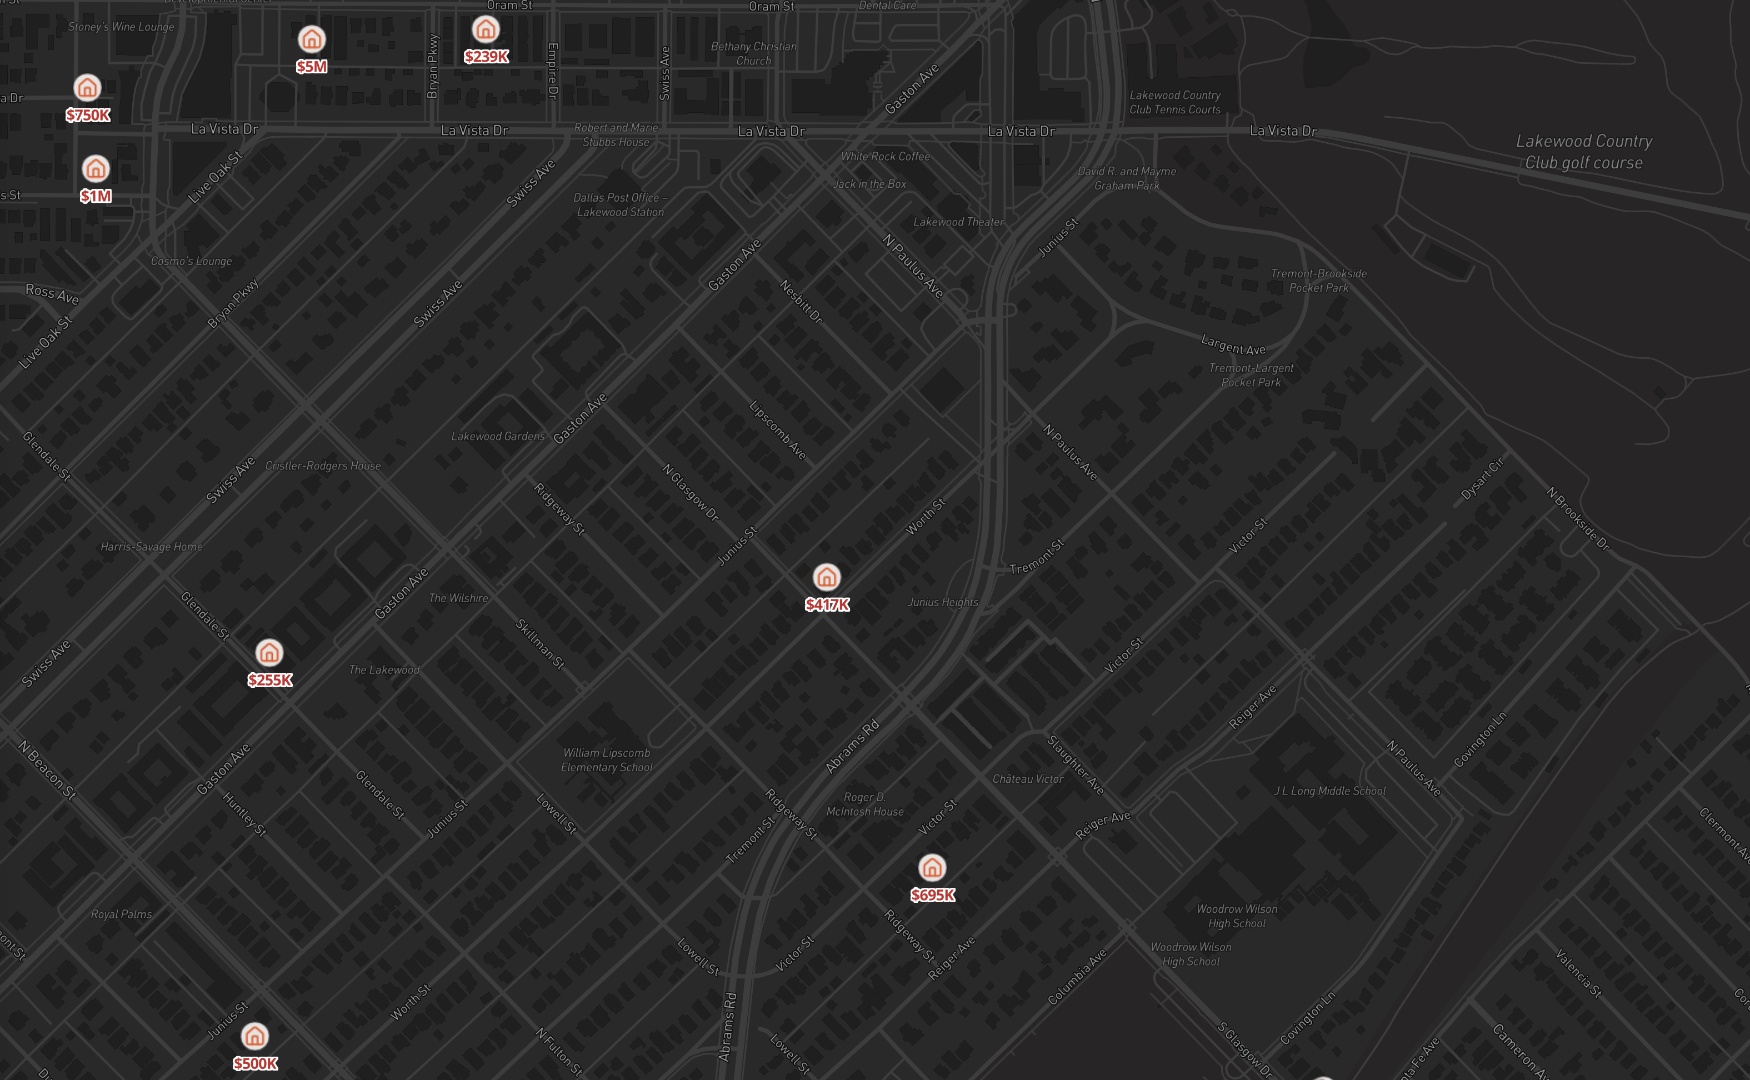
Compare asking prices and available listing details.
Homes for Rent#
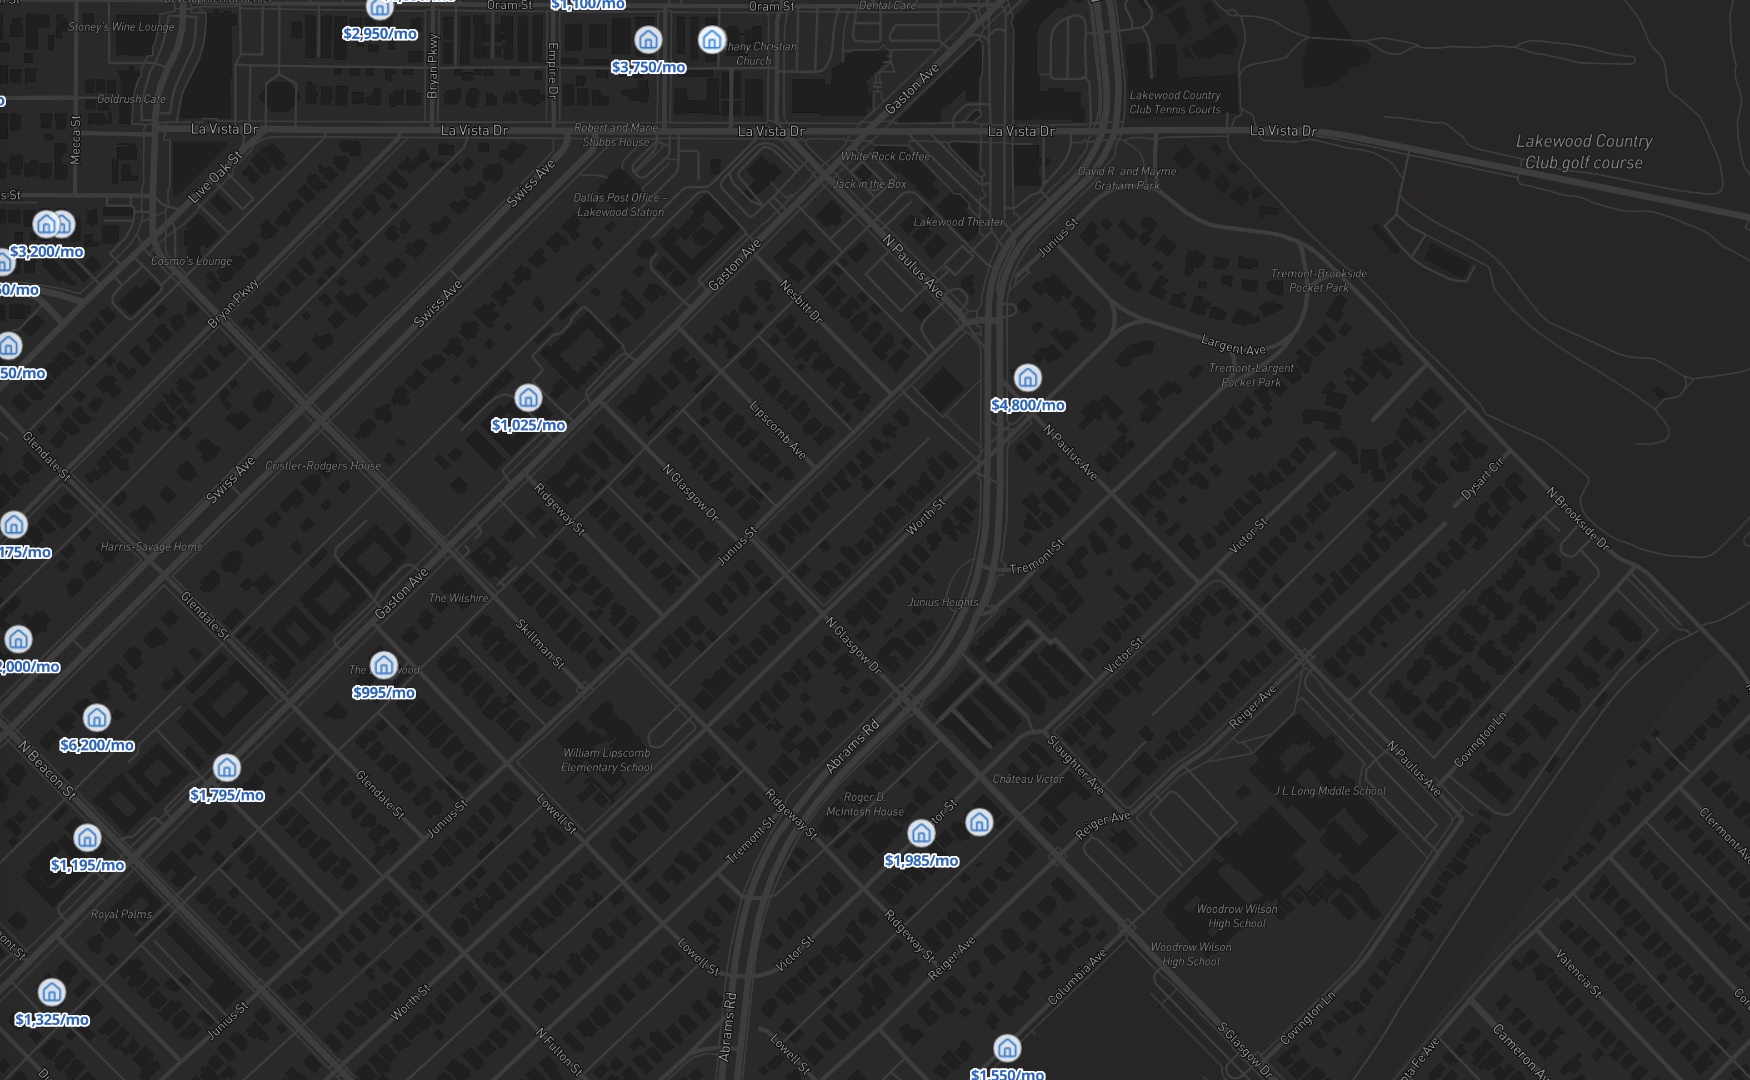
Review monthly asking rents and home characteristics.
Apartments for Rent#
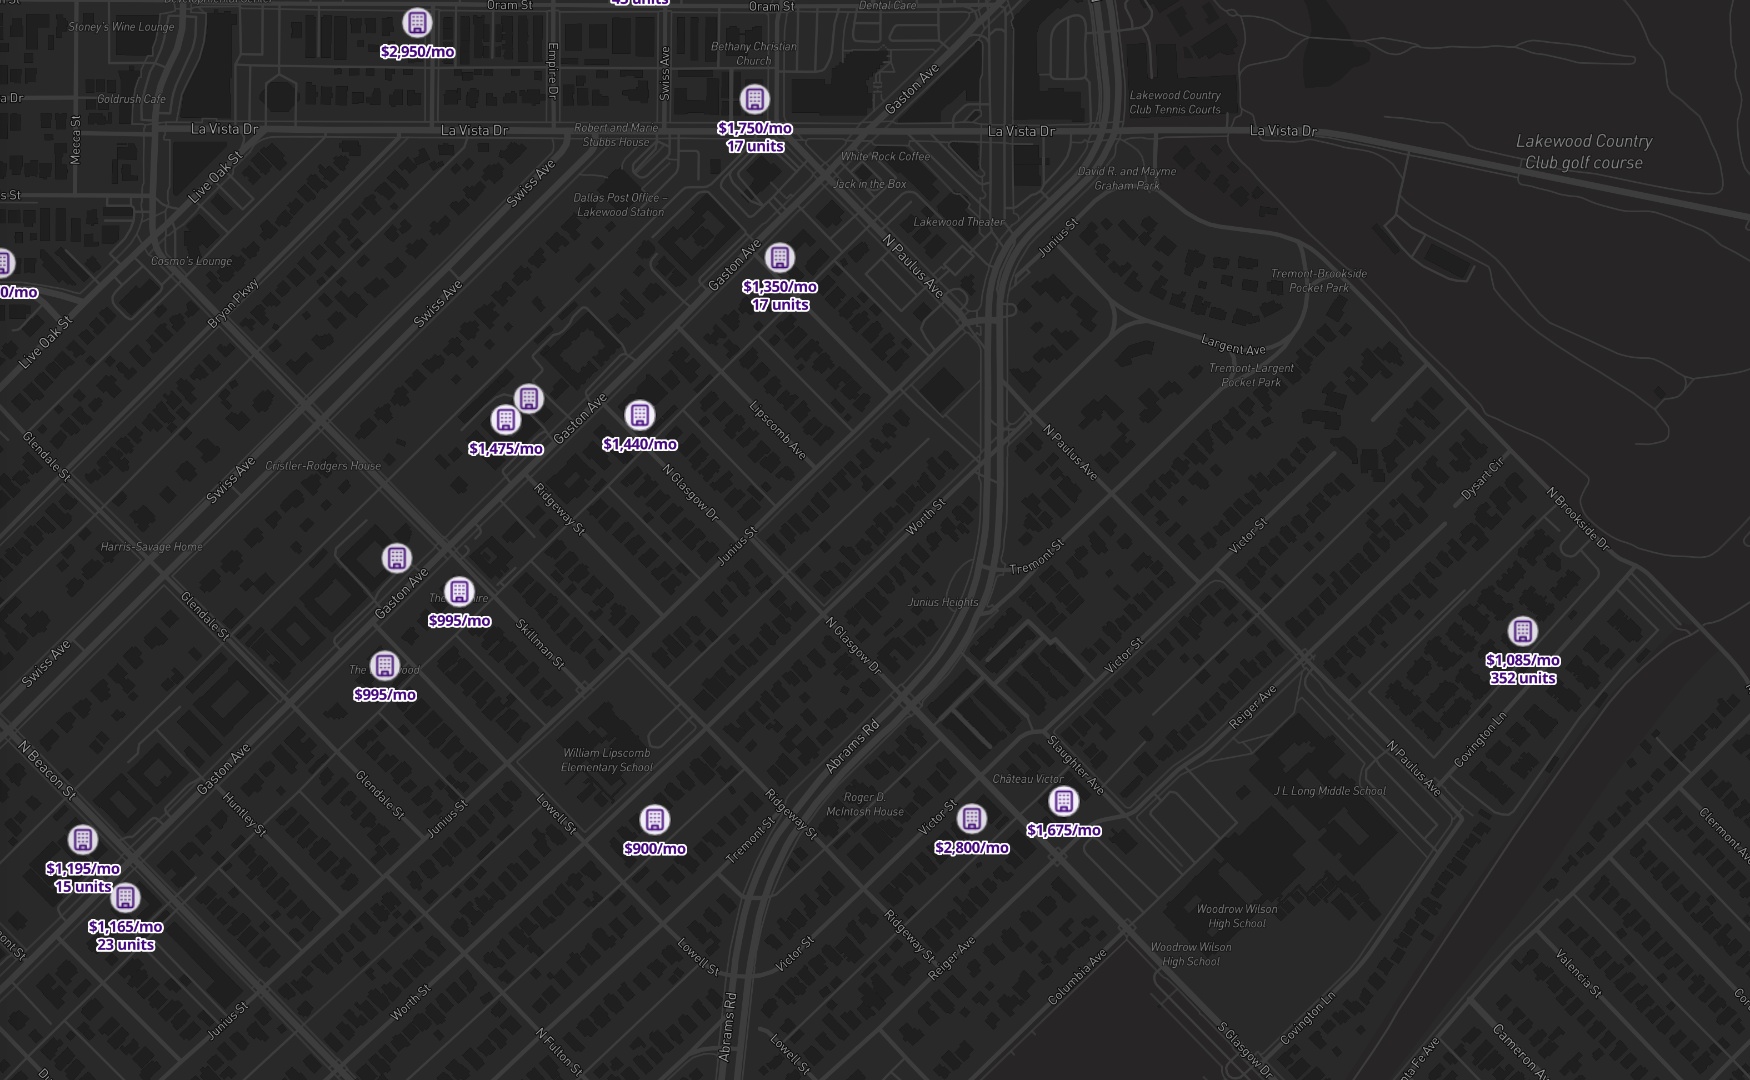
Explore apartment rents, unit sizes and available listing fields.
Land for Sale#
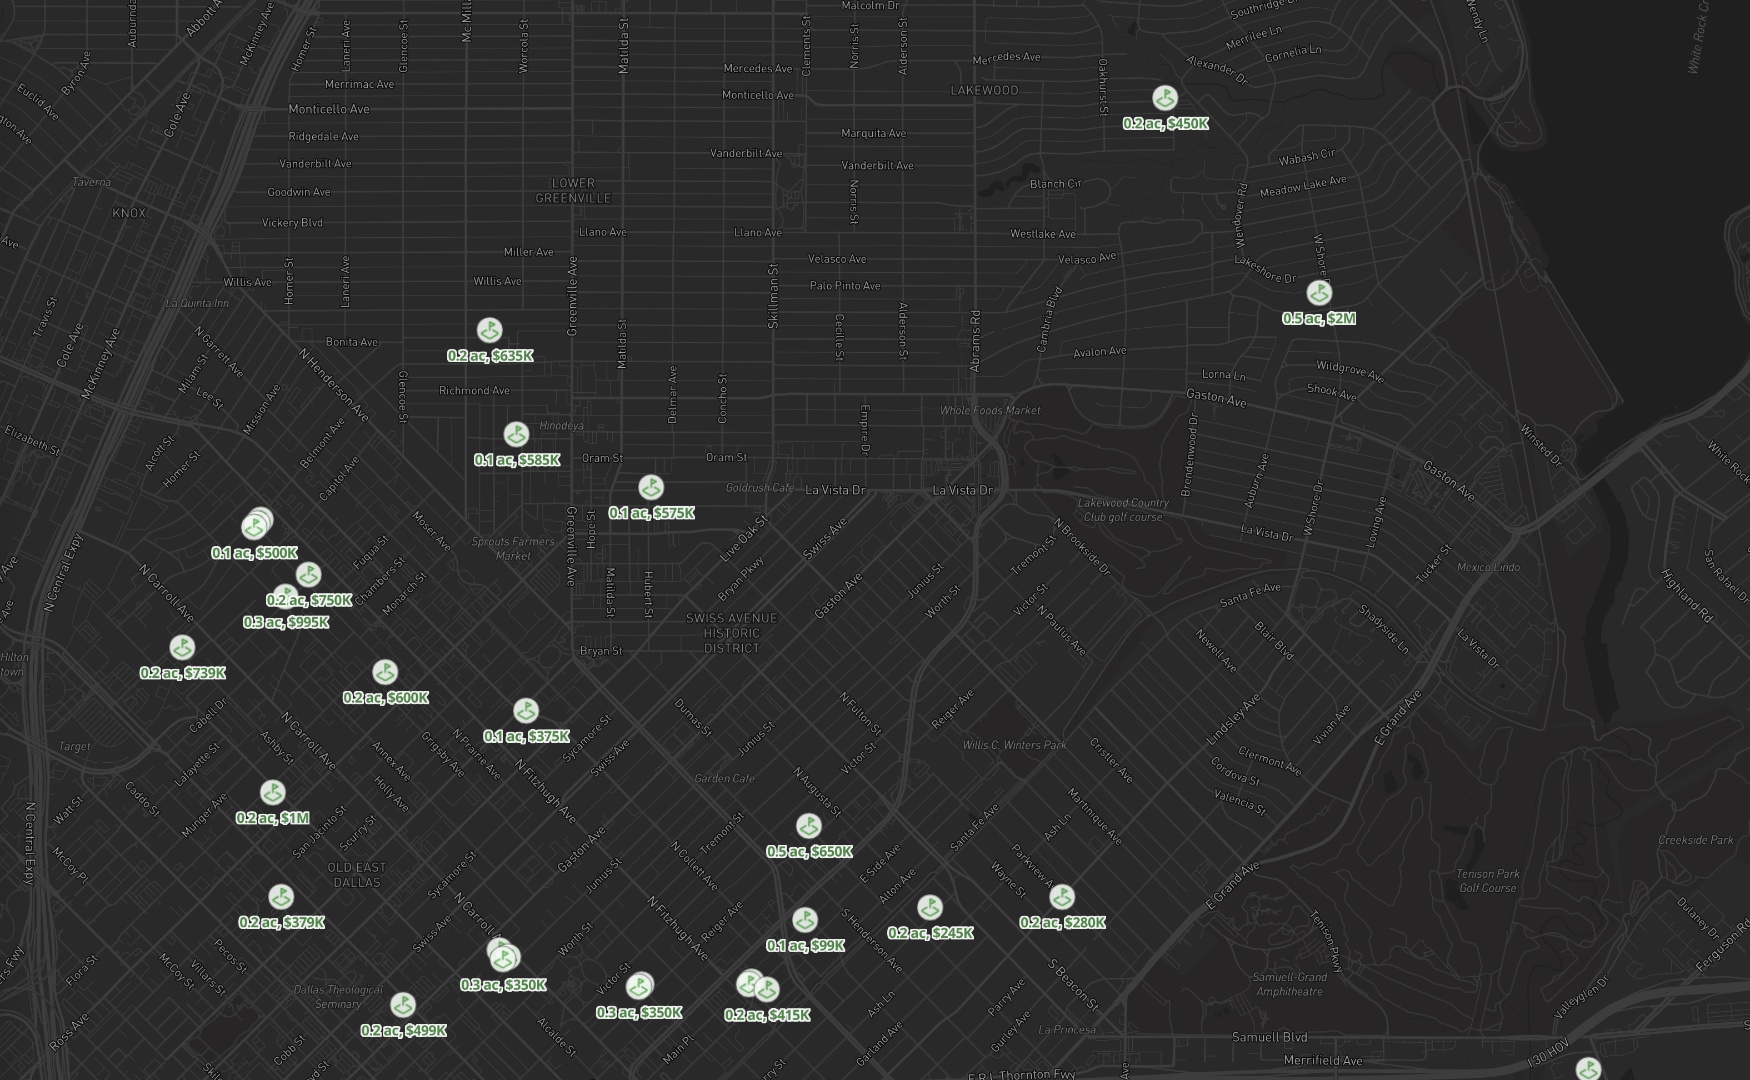
Compare asking price, acreage and price per acre for land.
Land Sold#
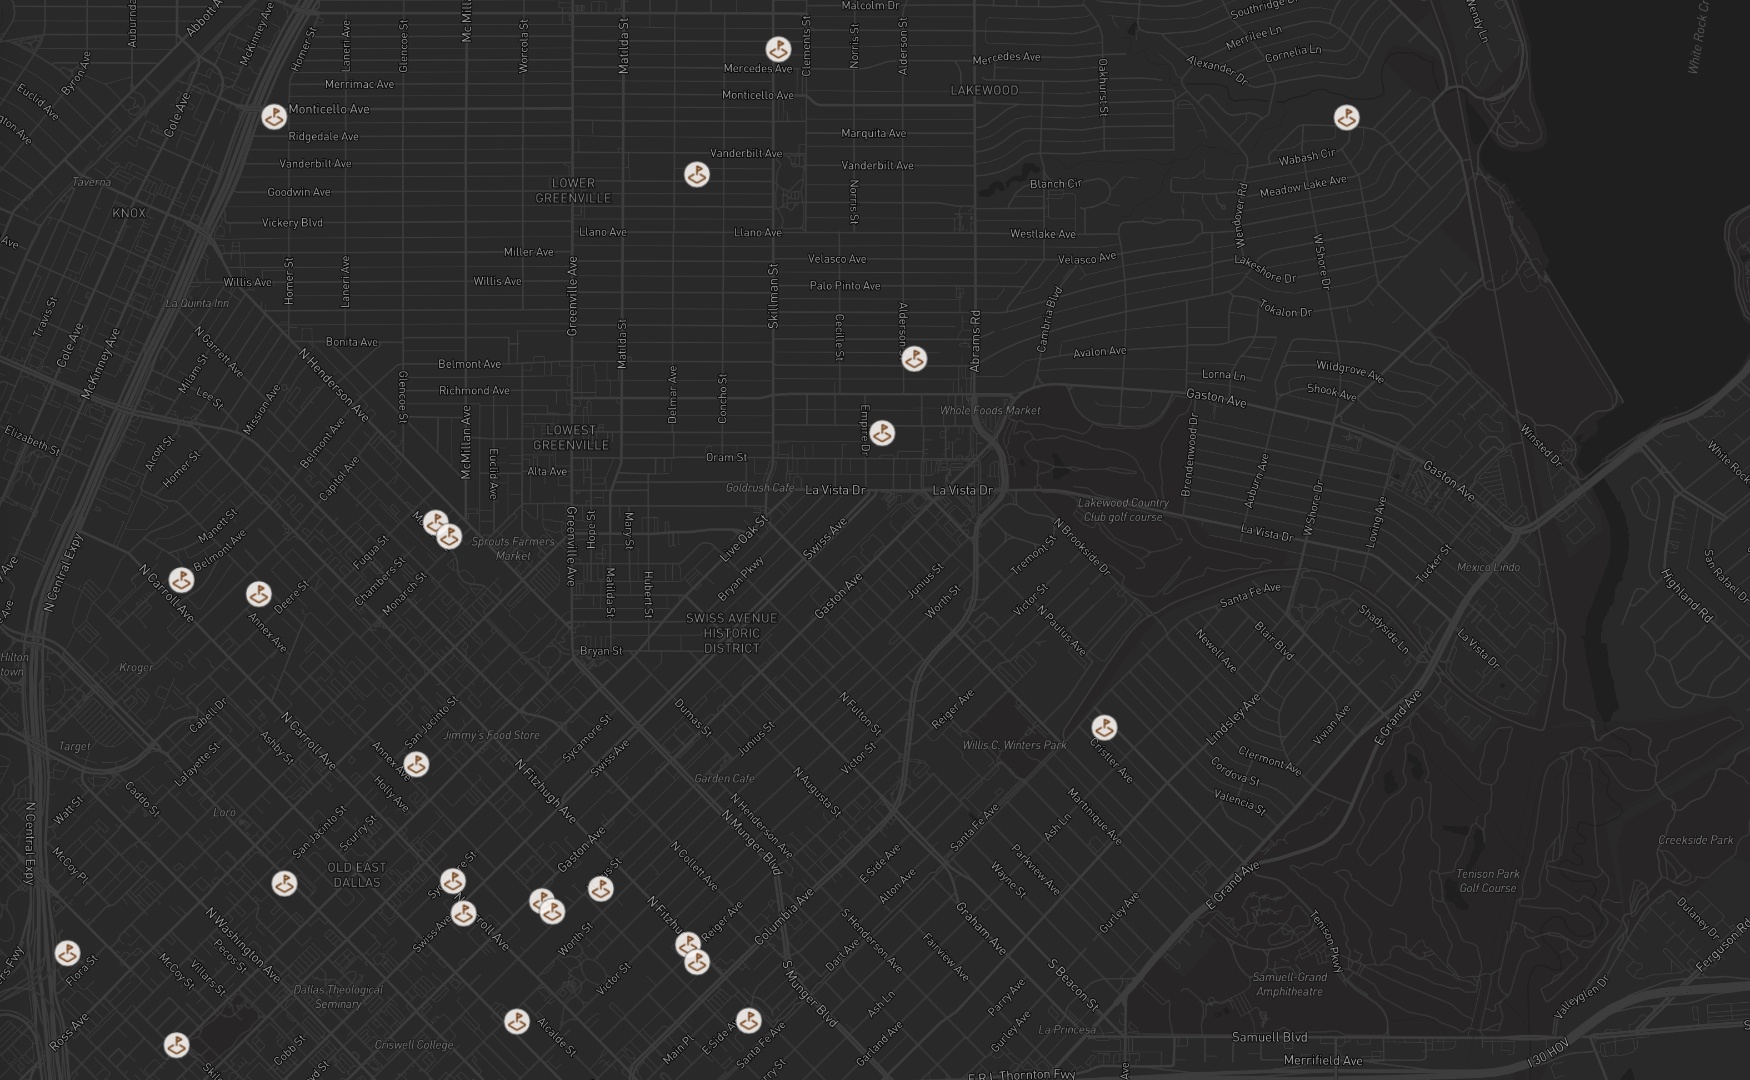
Review available land transactions and acreage.
New Neighborhoods#
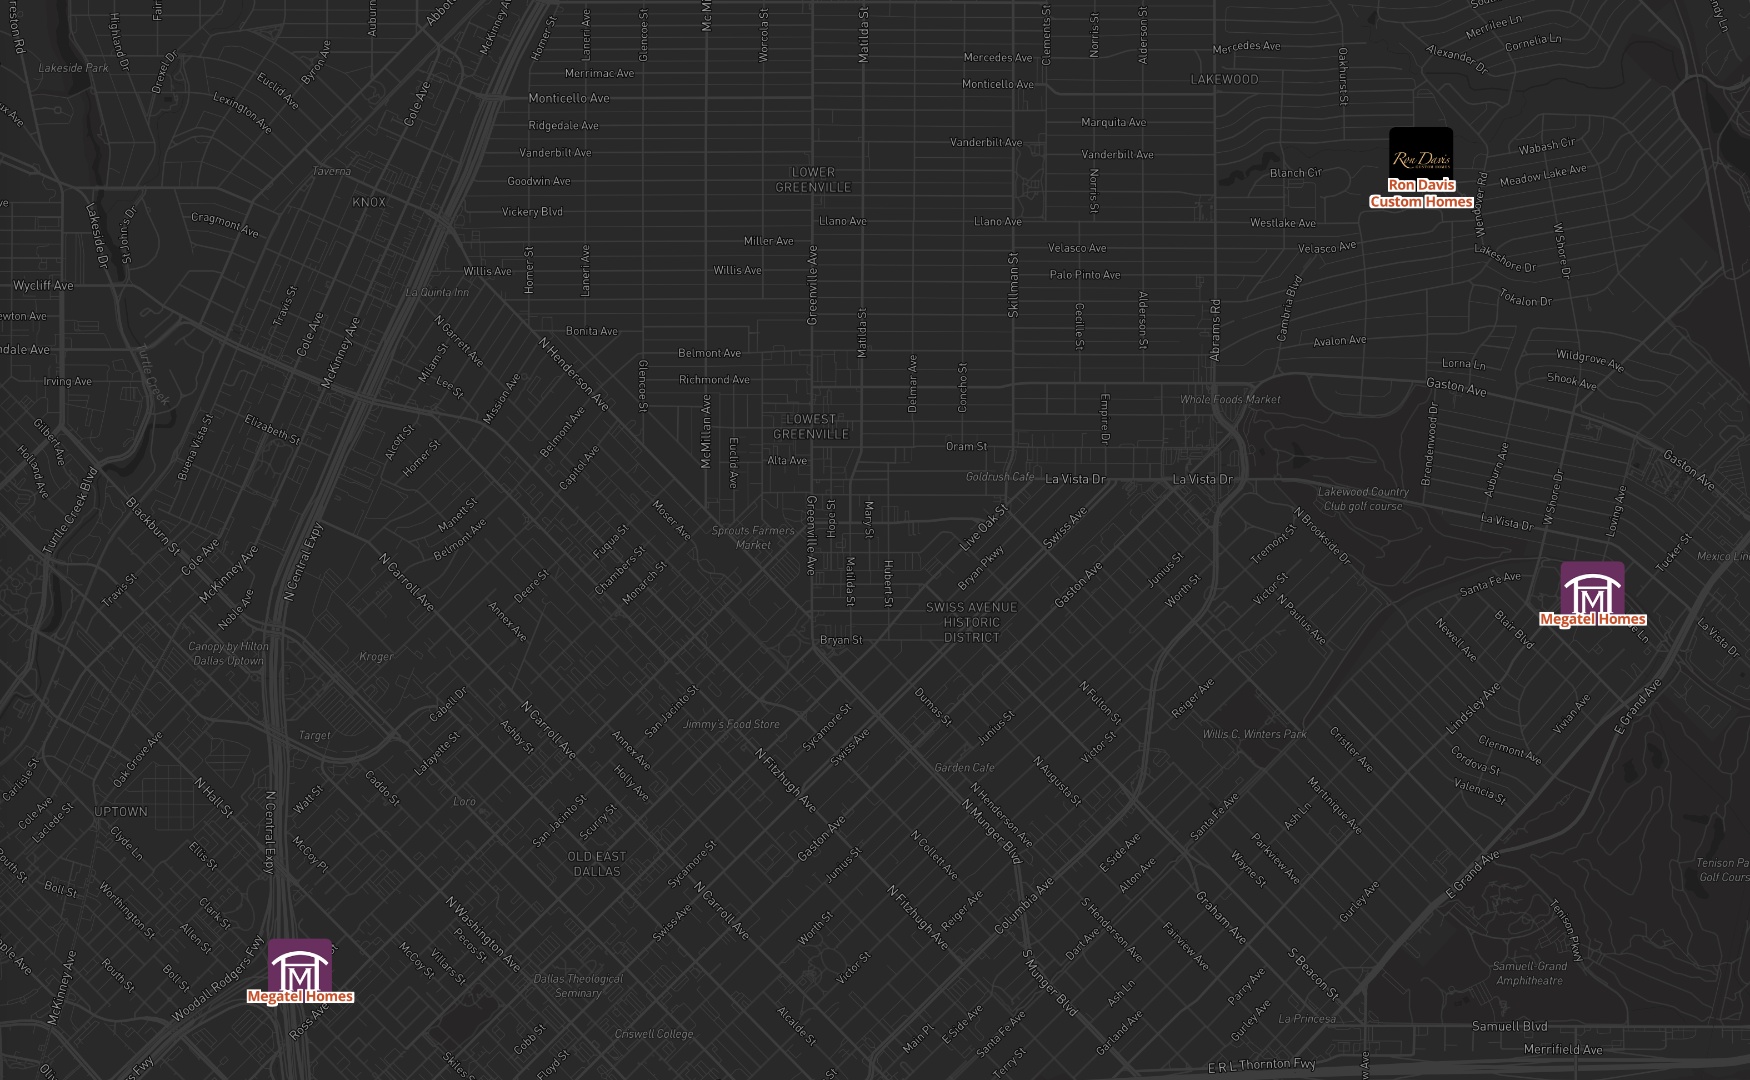
Explore nearby new communities and available development details.
Analyze the surrounding market#
Set radius rings or drive-time areas, then select a location to compare nearby market data and demographics.
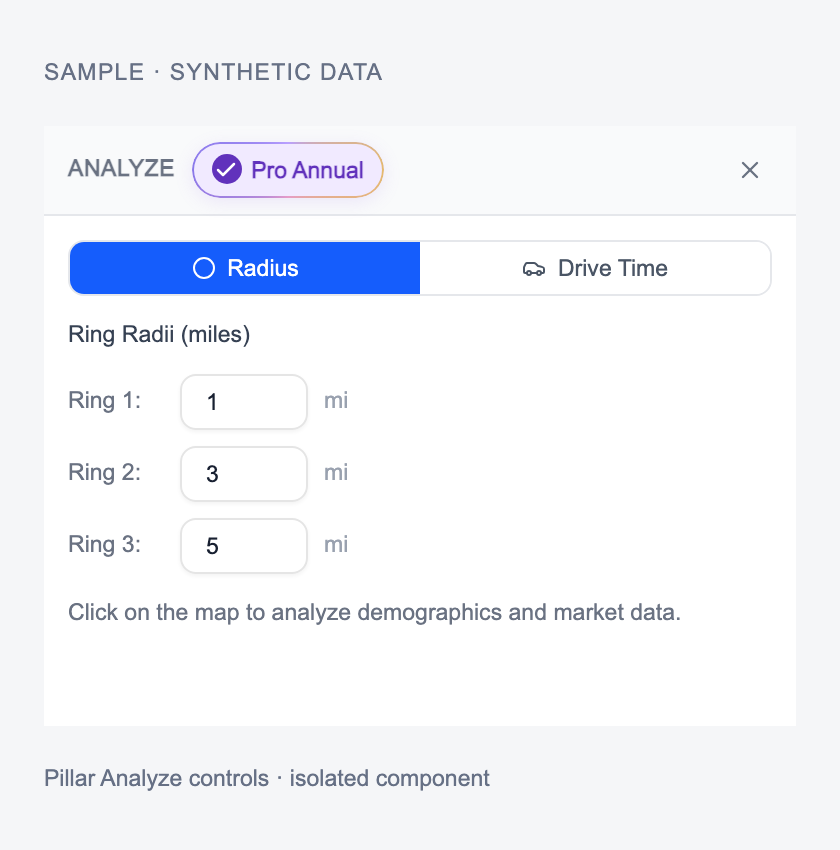
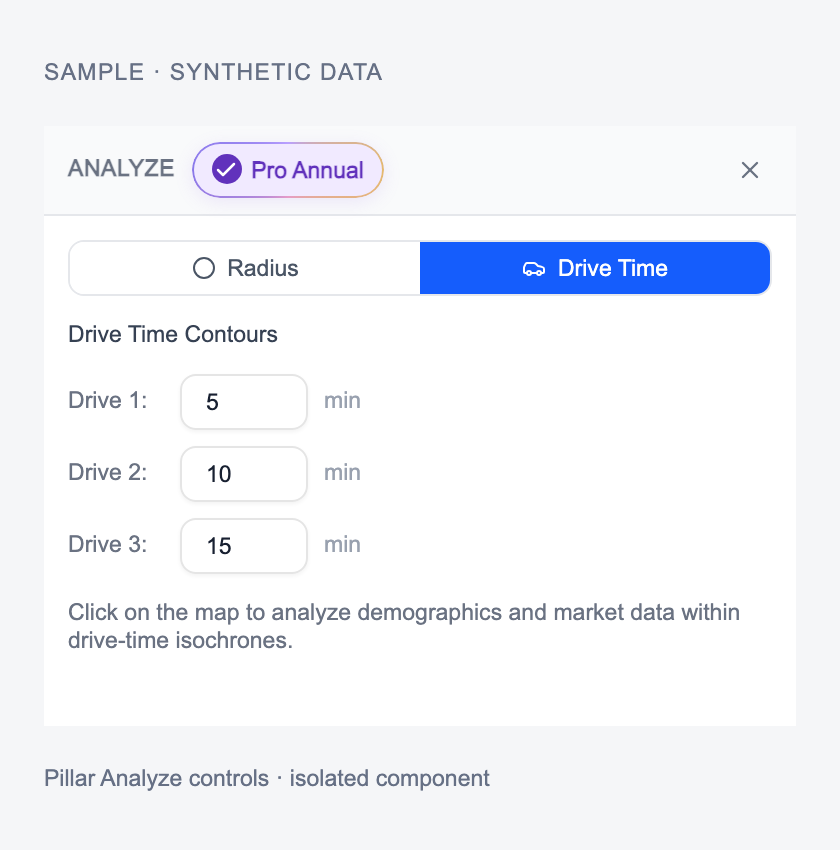
These are the current Analyze tool controls in an isolated paid-access sample. No live analysis was requested. See Analyze an area for the full report workflow.
Sample reports and exports#
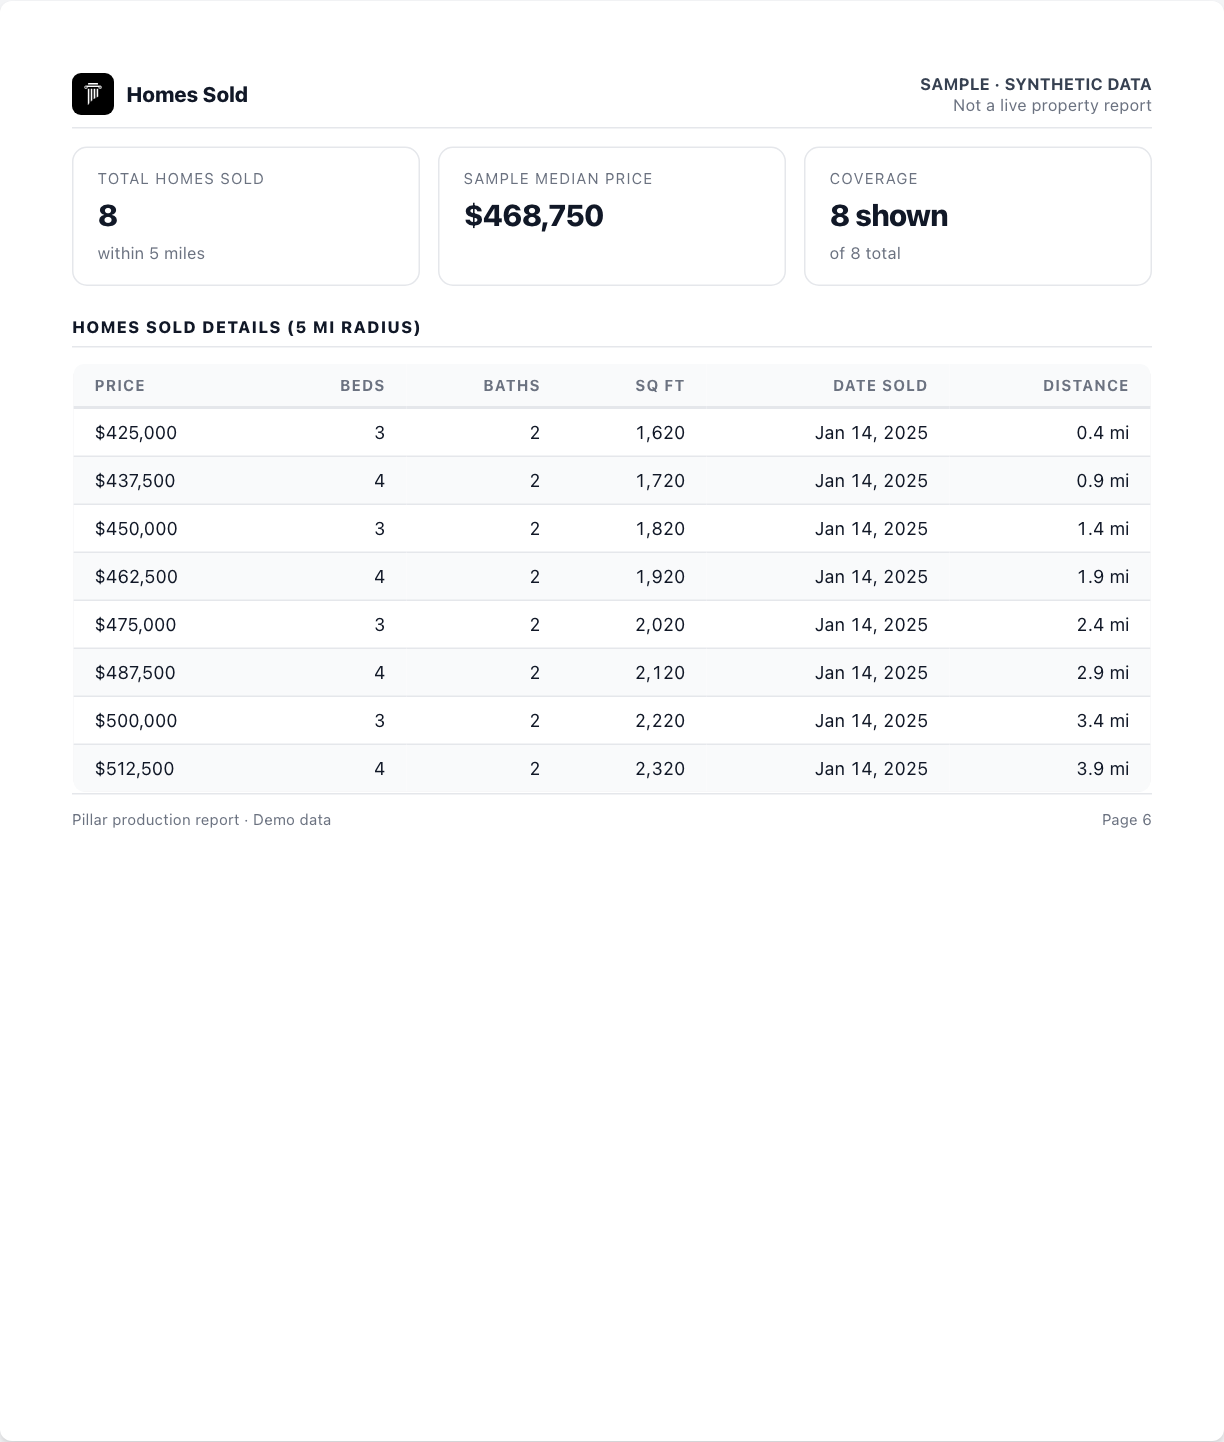
The report excerpt above comes from Pillar's production demographic report renderer using synthetic demo transactions. Its map slot is omitted here. The other report sections include home rentals, apartments and land sales.
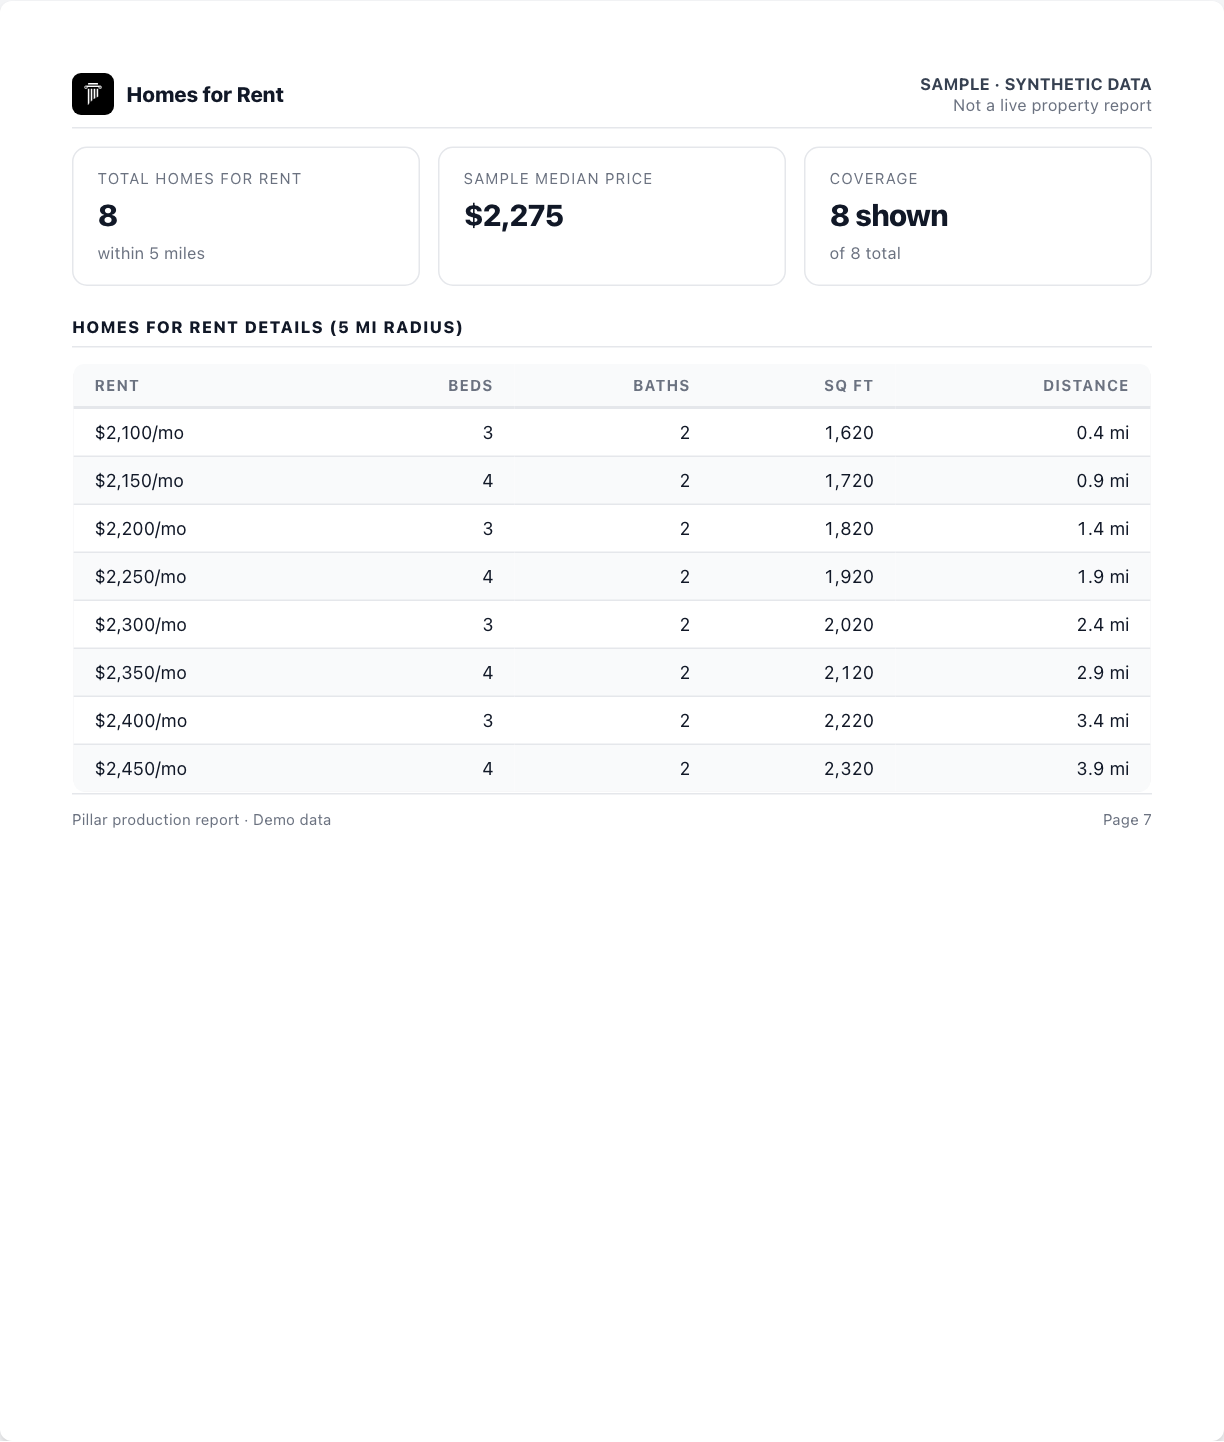
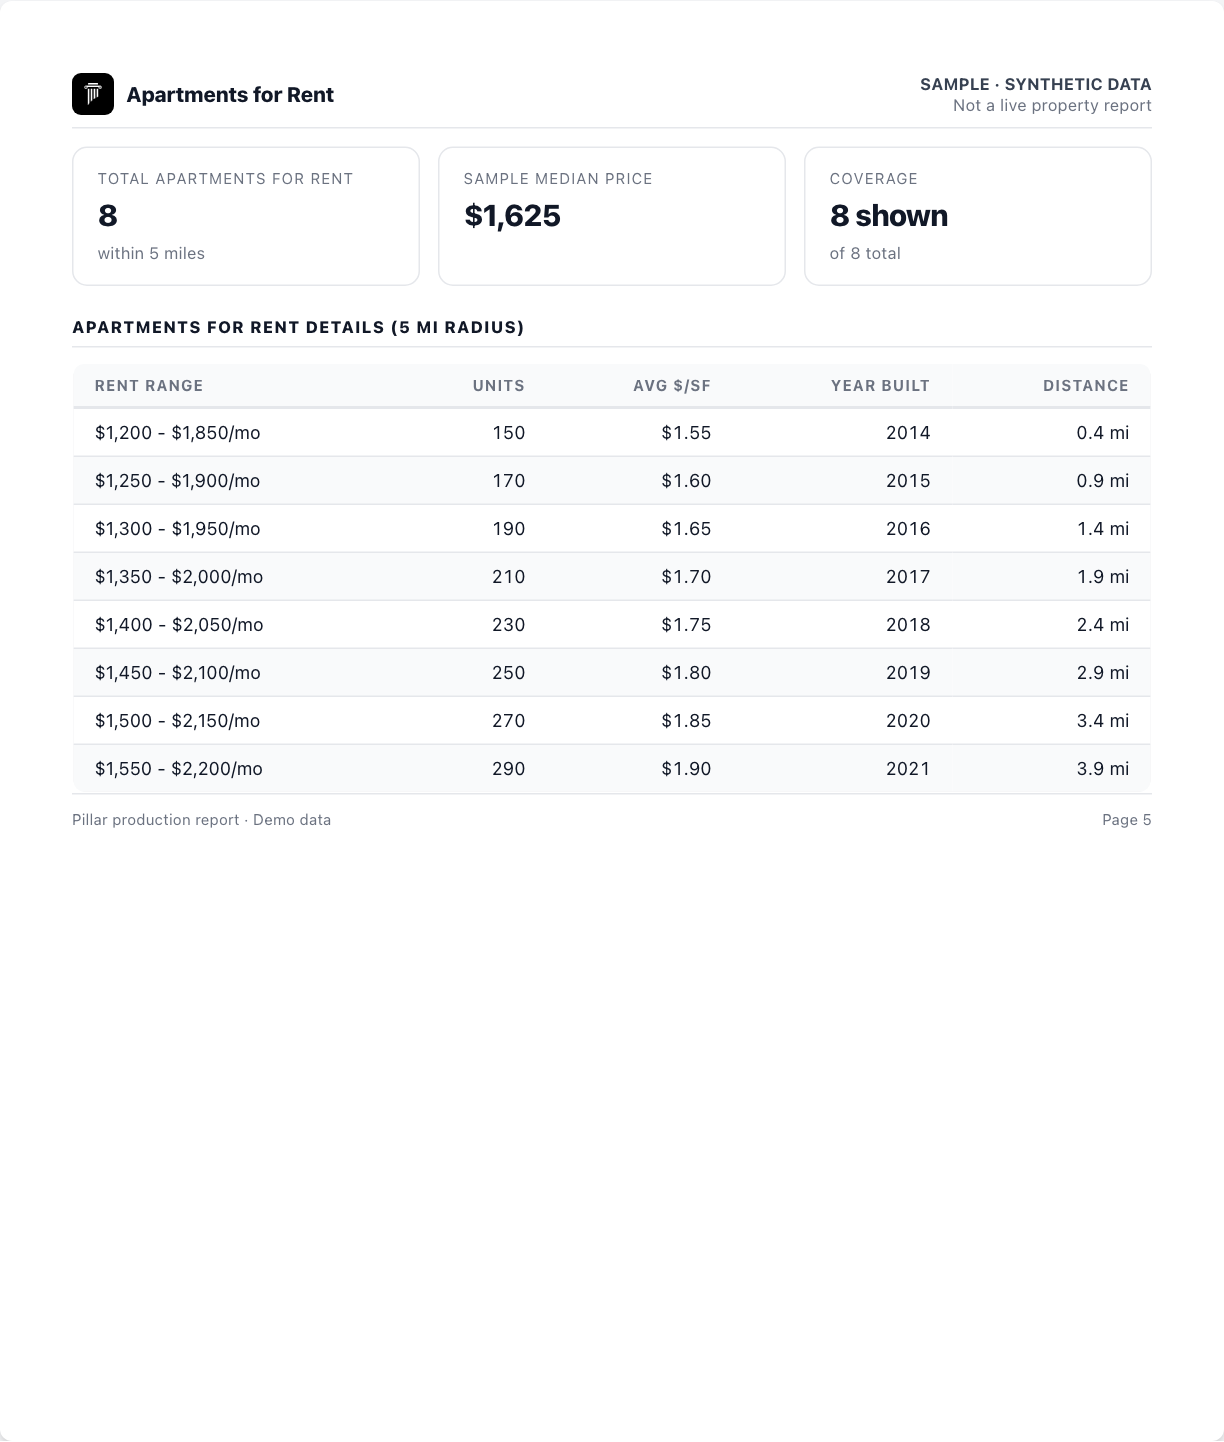
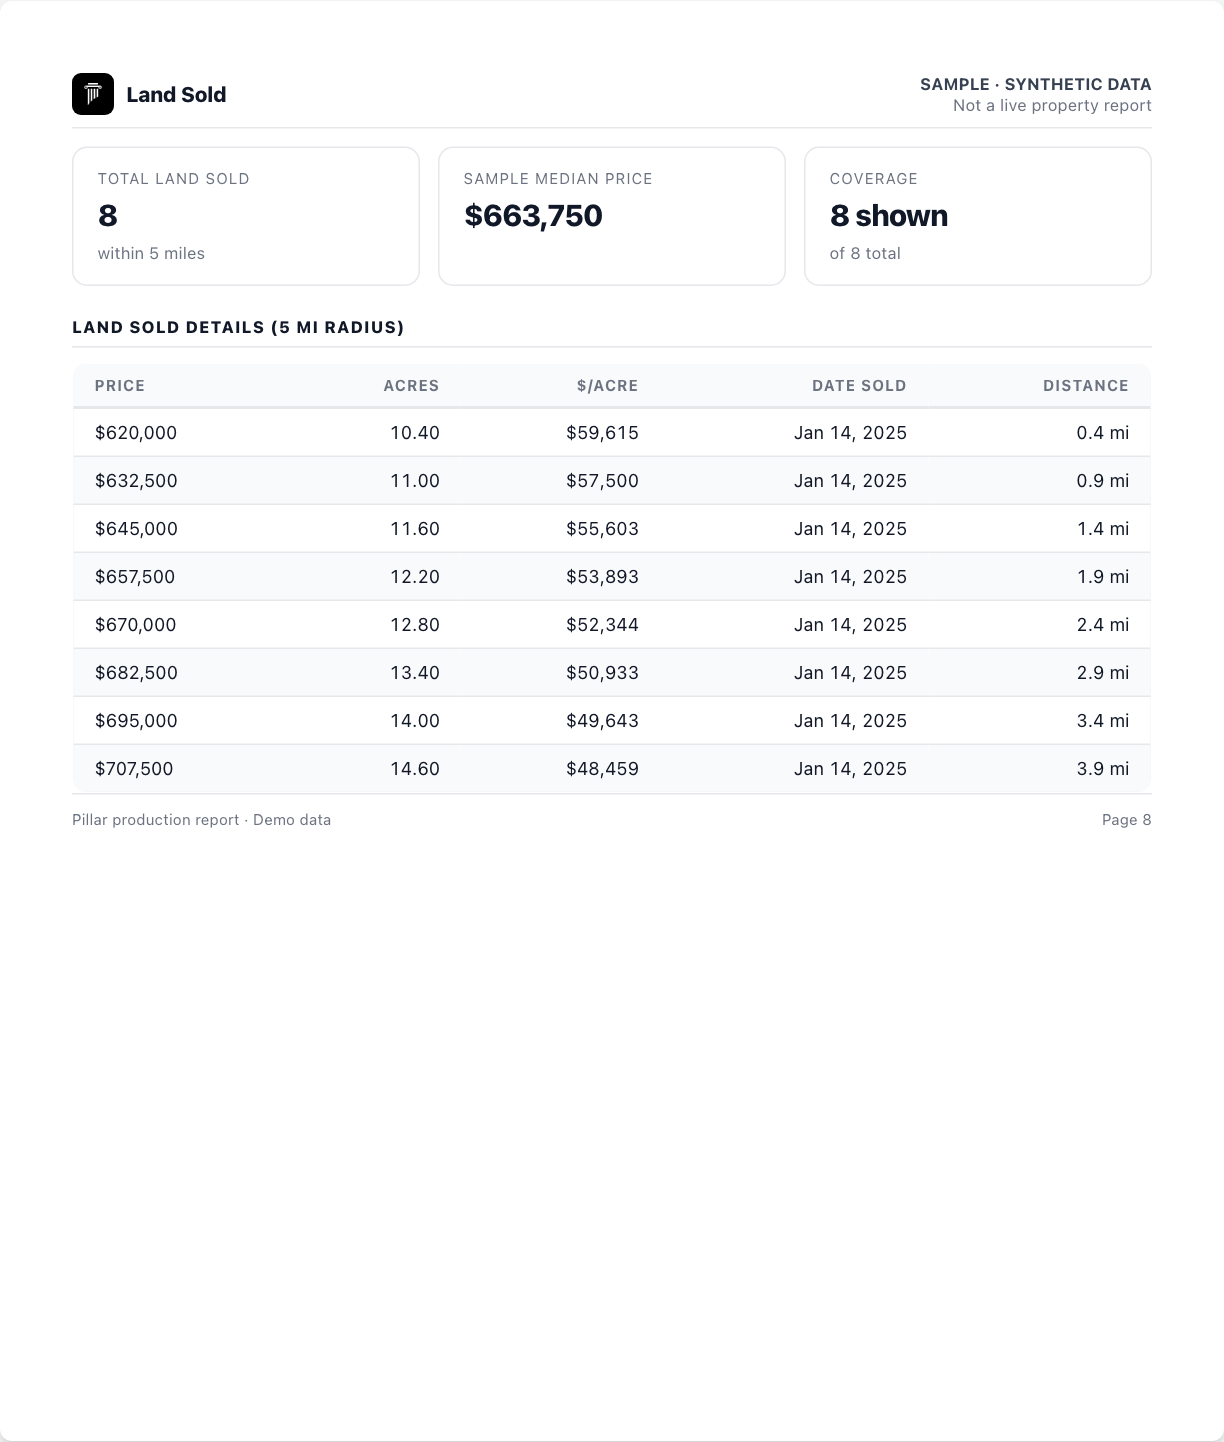
Download the sample report (PDF) · Download the sample data export (Excel)
The report and workbook use the current report renderer and Export Data action. All values are sample data.
Plans and limits#
See Plans and limits for current Free, trial, Pro and Pro Annual allowances. The app checks your current access before a paid action.