
Trade-area analysis
Compare the people, housing and market around a site.
Trade-area analysis#
Compare the people, housing and market around a site.
Access: Pro Annual. AGS demographic reports are included with Pro Annual and do not use credits. The seven-day trial includes three AGS reports. Data coverage and vintage vary.
Demographic report#
This screenshot comes from Pillar's actual report renderer, populated with synthetic demo data. It shows the output layout you receive, not an illustration or a live report about Raleigh.
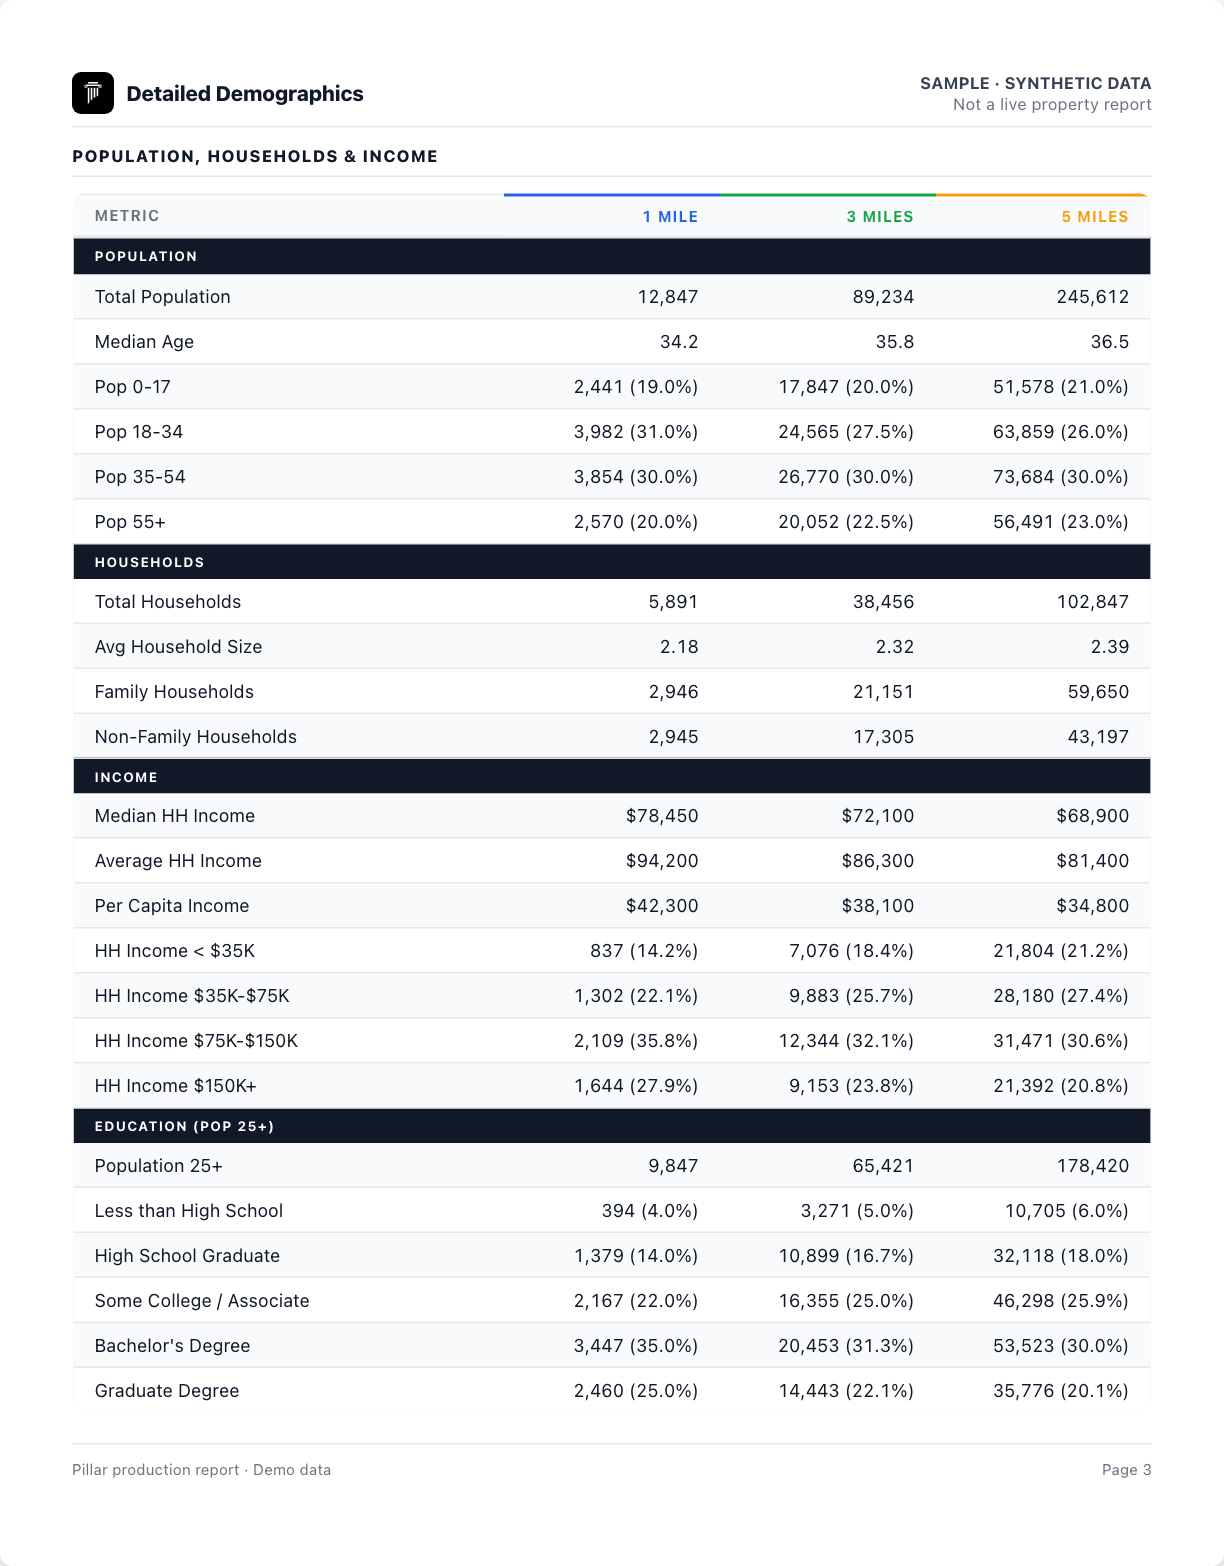
Download the sample demographic and market report (PDF) · Download the actual sample data export (Excel)
The PDF contains the populated demographic and market-data pages. Site overview and map pages are omitted because this isolated sample does not fetch provider imagery. No credits were spent to create it.
Housing and employment#
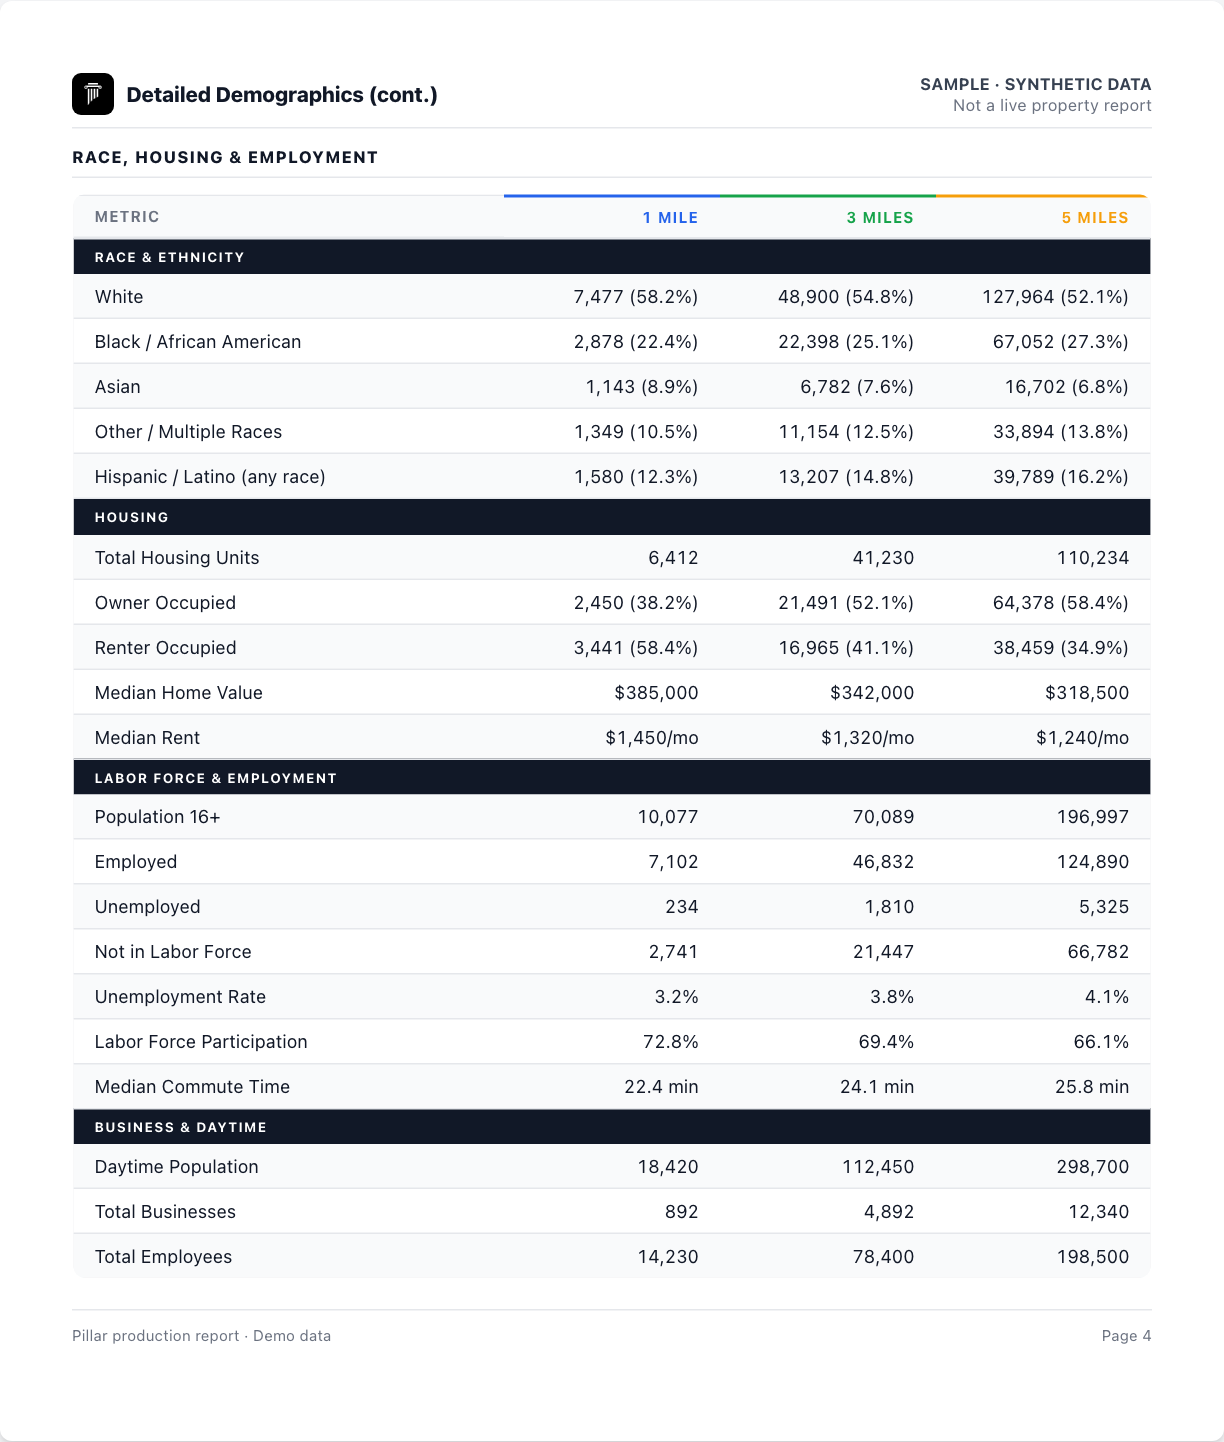
What you get#
Choose a radius or drive-time area, then compare population, income, age and housing across the selected areas. Market tables add sales and rental context where coverage is available.
Read the example#
| Detail | 1 mile | 3 miles | 5 miles |
|---|---|---|---|
| Population | 8,240 | 61,300 | 142,800 |
| Households | 3,180 | 24,700 | 58,400 |
| Median HH income | $86,400 | $92,100 | $88,700 |
| Median age | 37.2 | 38.6 | 39.1 |
The screenshots and downloadable report above use the current production report components. Example values below explain the fields; they are not provider measurements.
Try it in Pillar#
- Open Analyze in the map toolbar.
- Choose radius or drive-time areas and select a site.
- Compare the area tabs; generate the report or export available comparable data.
Plans and limits#
See Plans and limits for current Free, trial, Pro and Pro Annual allowances. The app checks your current access before a paid action.